
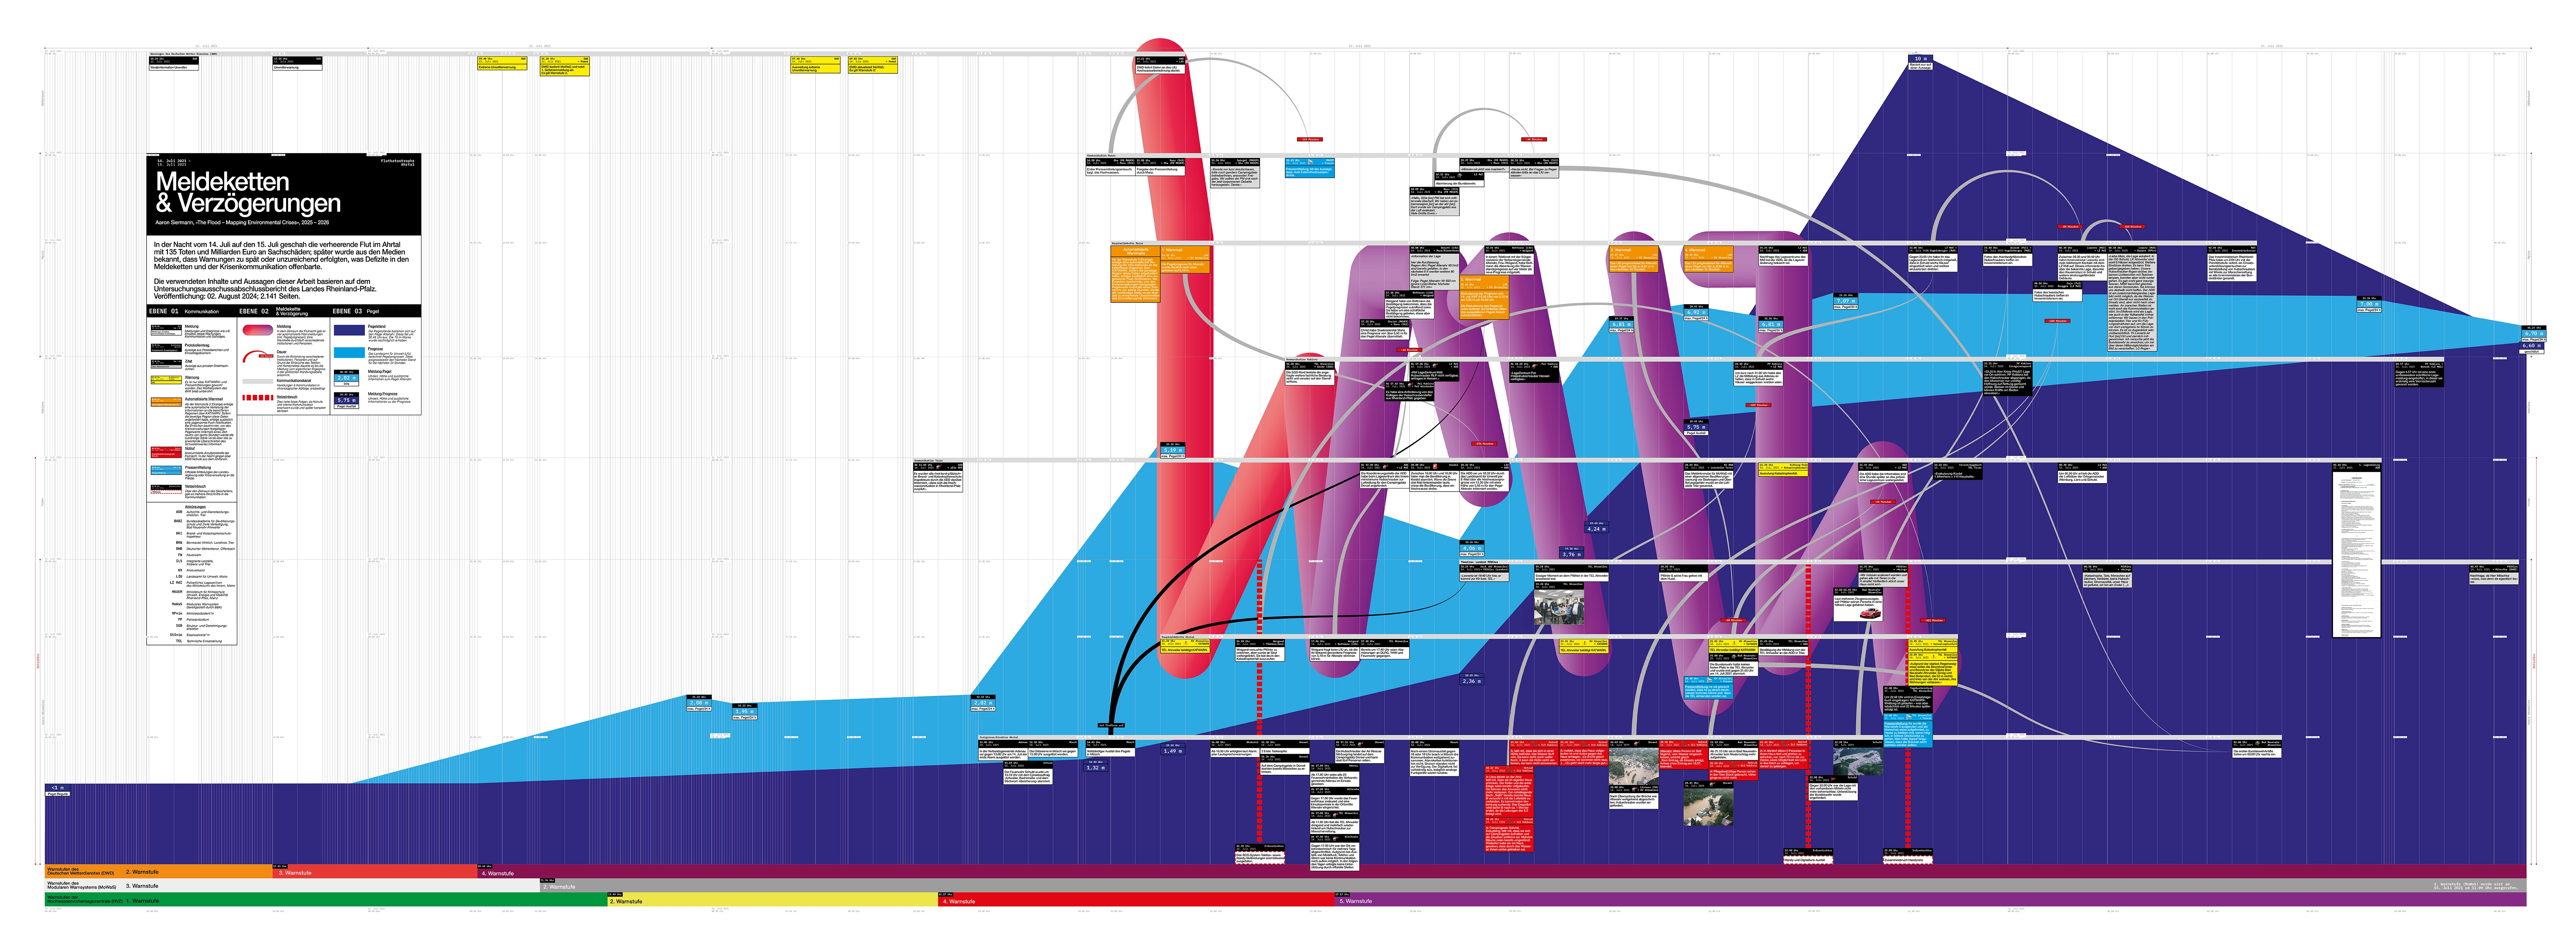
This project investigates communication structures during the Ahr Valley flood between 14 and 15 July 2021. While media coverage often focused on the visible consequences of the disaster, my interest lay in the invisible processes behind it: the flow of information between local authorities, emergency services, administrative institutions, and political decision-makers. The central question was how delays emerged within these reporting chains and how communication breakdowns influenced the perception of the situation.
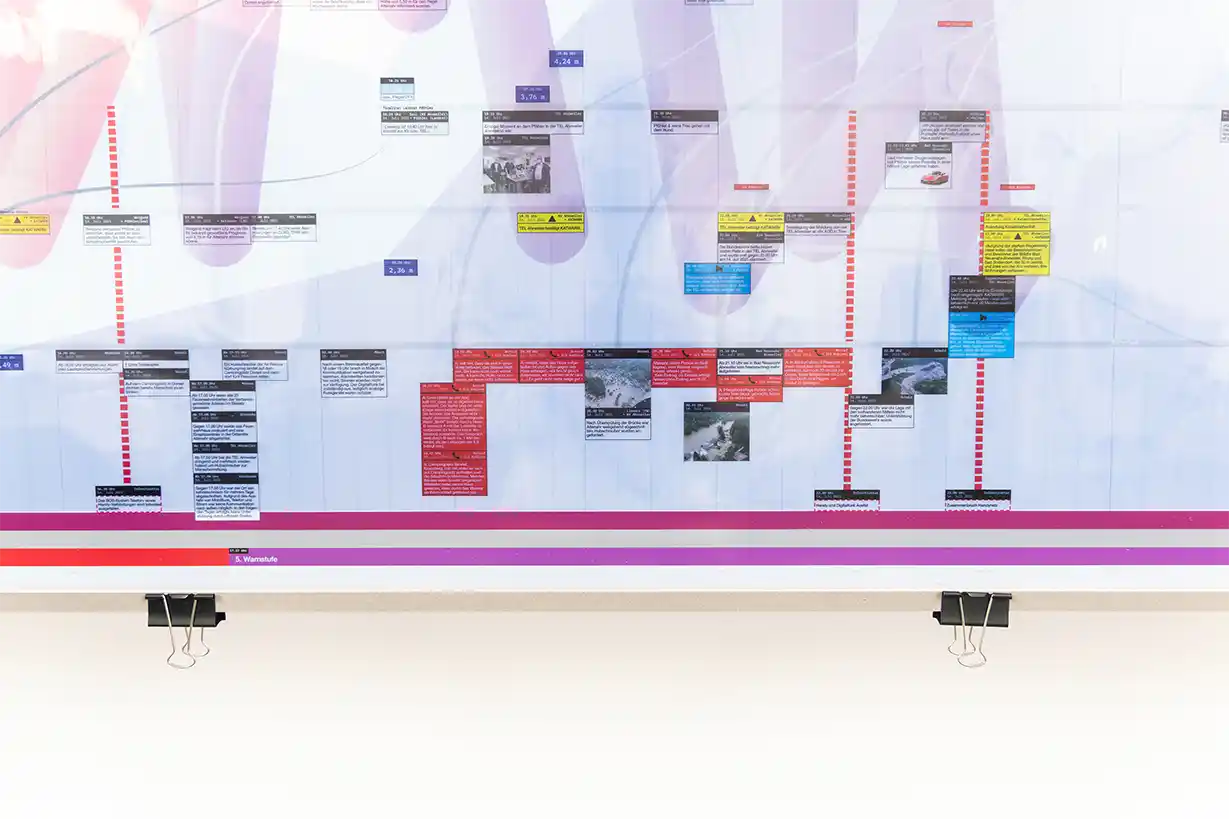
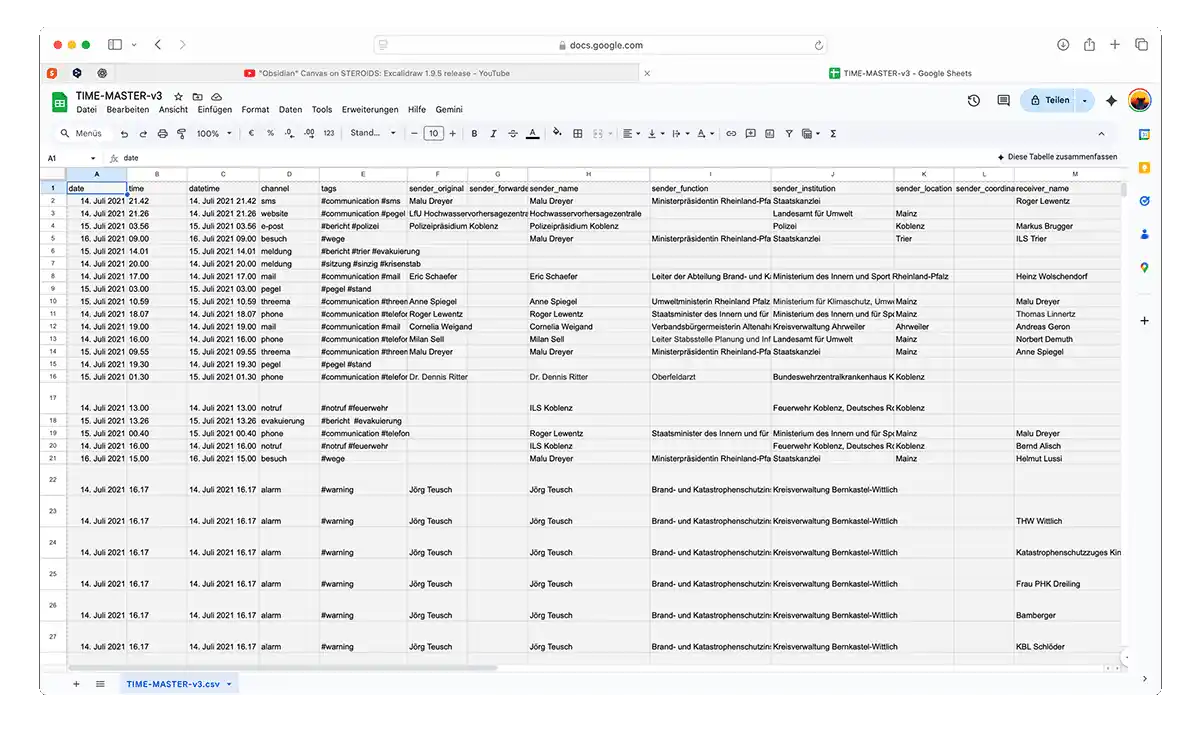
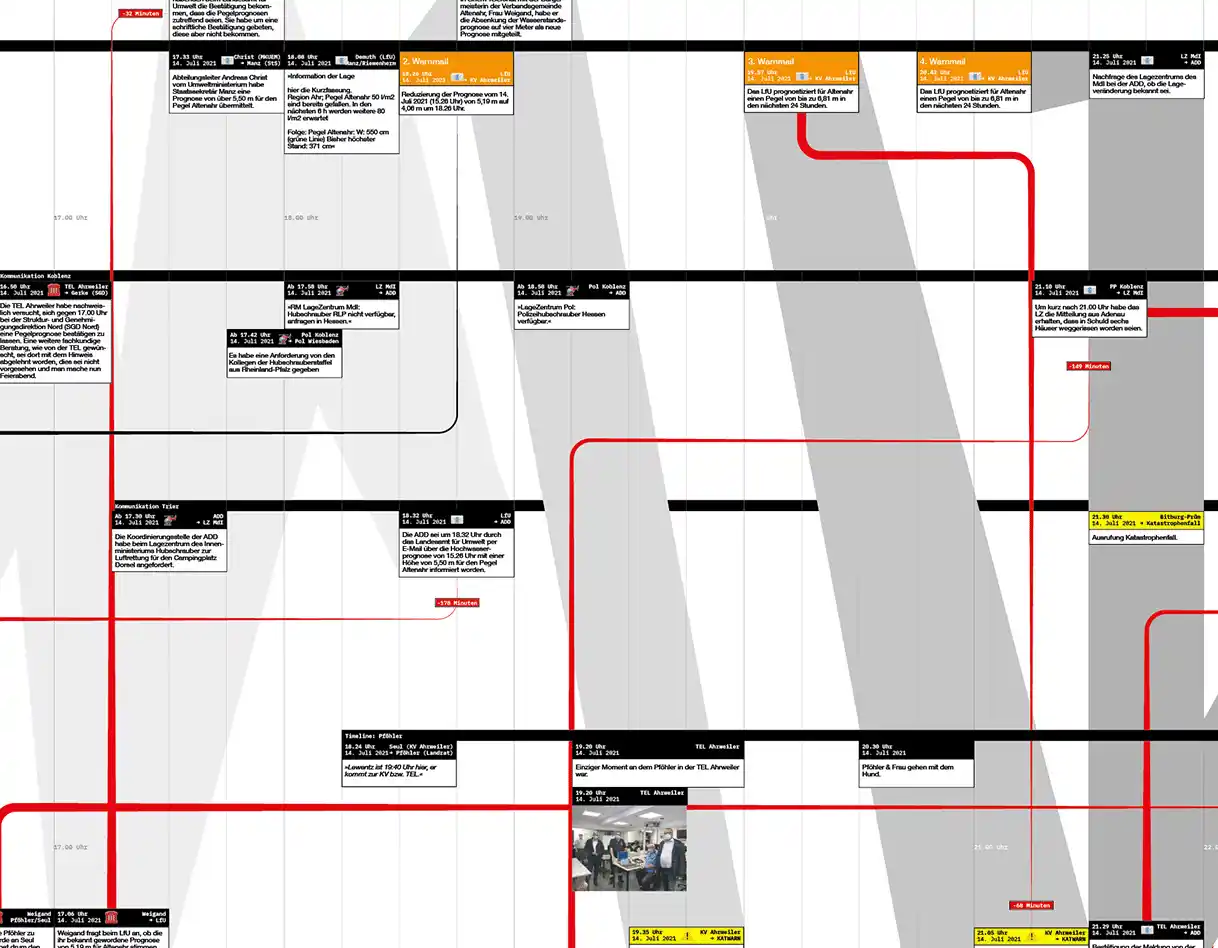
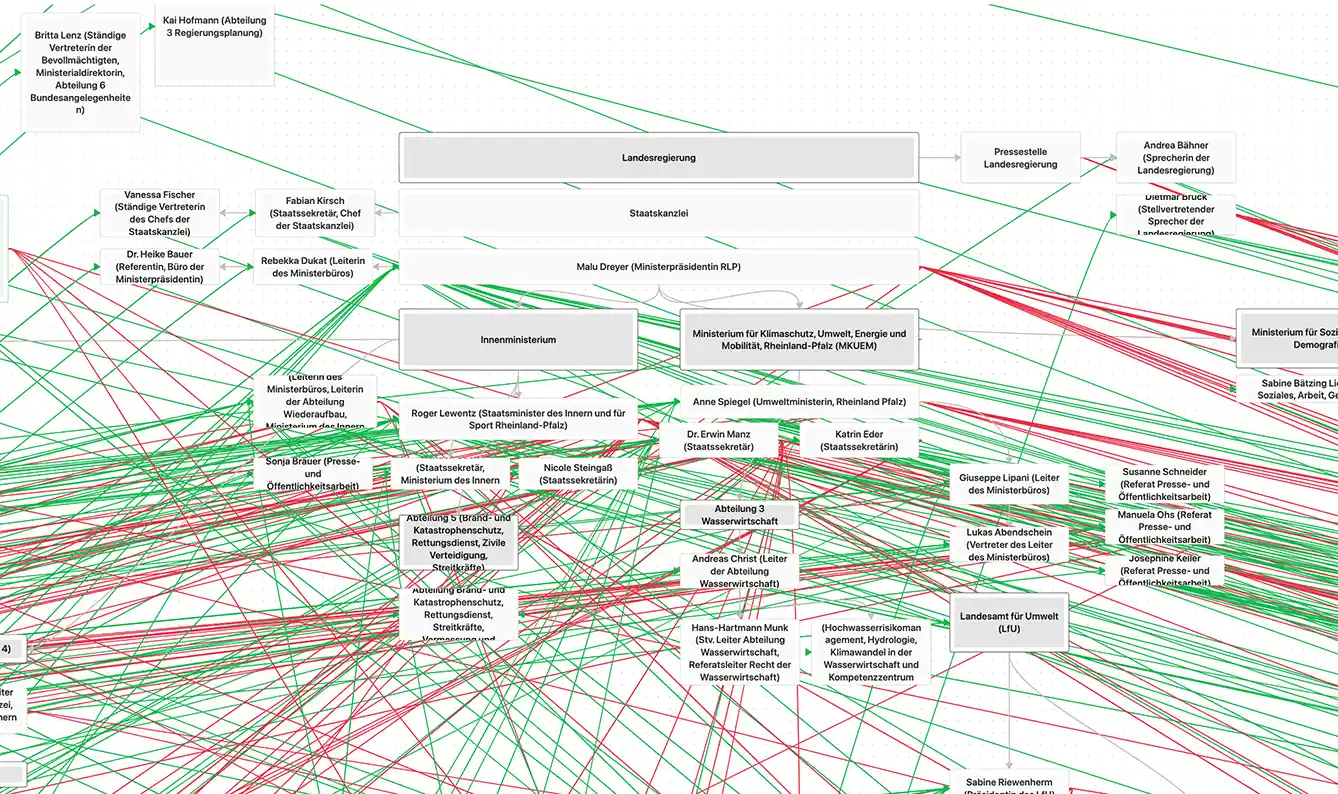
The starting point for the research was the 2,141-page final report of the Parliamentary Investigation Committee of Rhineland-Palatinate. Rather than focusing on individual messages or decisions, I was interested in the relationships between actors, institutions, locations, and events. To analyze these connections, I built a structured archive consisting of hundreds of reports, warnings, emails, phone calls, and official communications. By linking people, institutions, timestamps, and locations, the archive gradually revealed a complex network of interactions rather than a linear chain of information. A key finding emerged early in the process: the communication structures described in official procedures differed significantly from their practical implementation during the disaster. While reporting chains are typically conceived as clear, hierarchical, and sequential systems, the collected material revealed overlapping communication channels, parallel decision-making processes, missing information, and delayed responses. Particularly striking was the discrepancy between the urgency experienced on the ground and the perception of the situation at higher administrative and political levels.
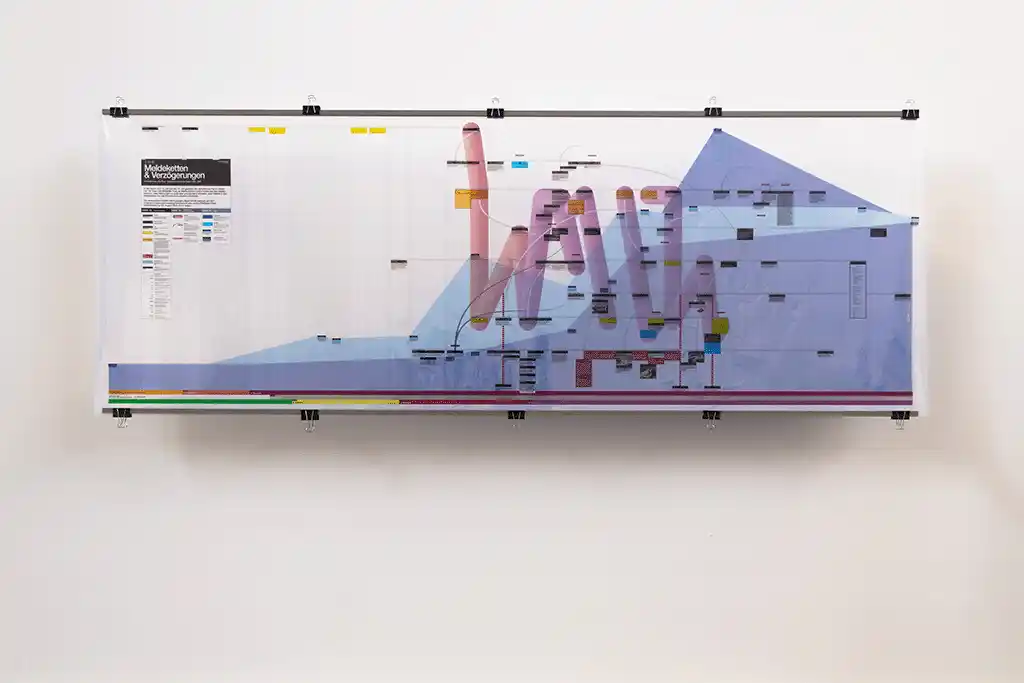
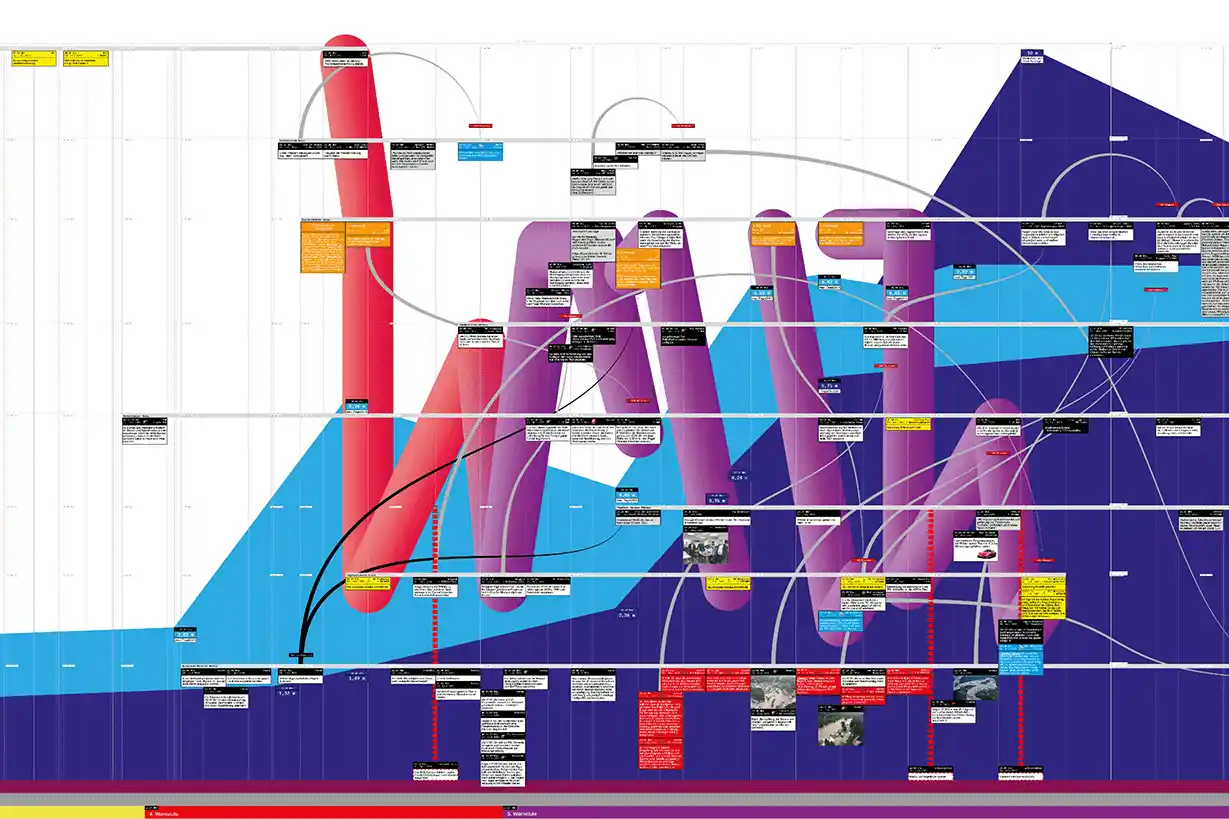
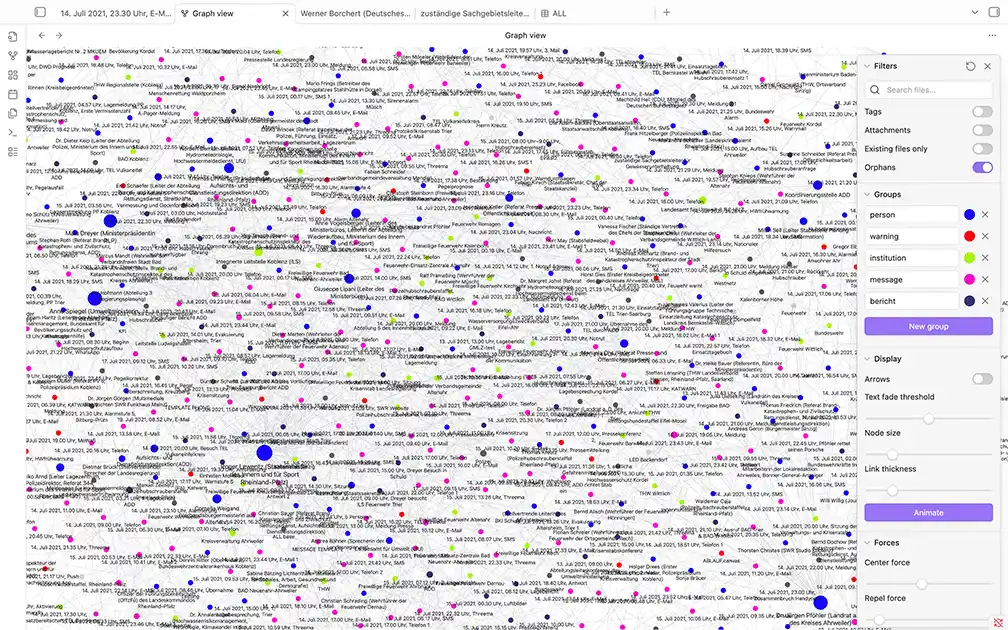
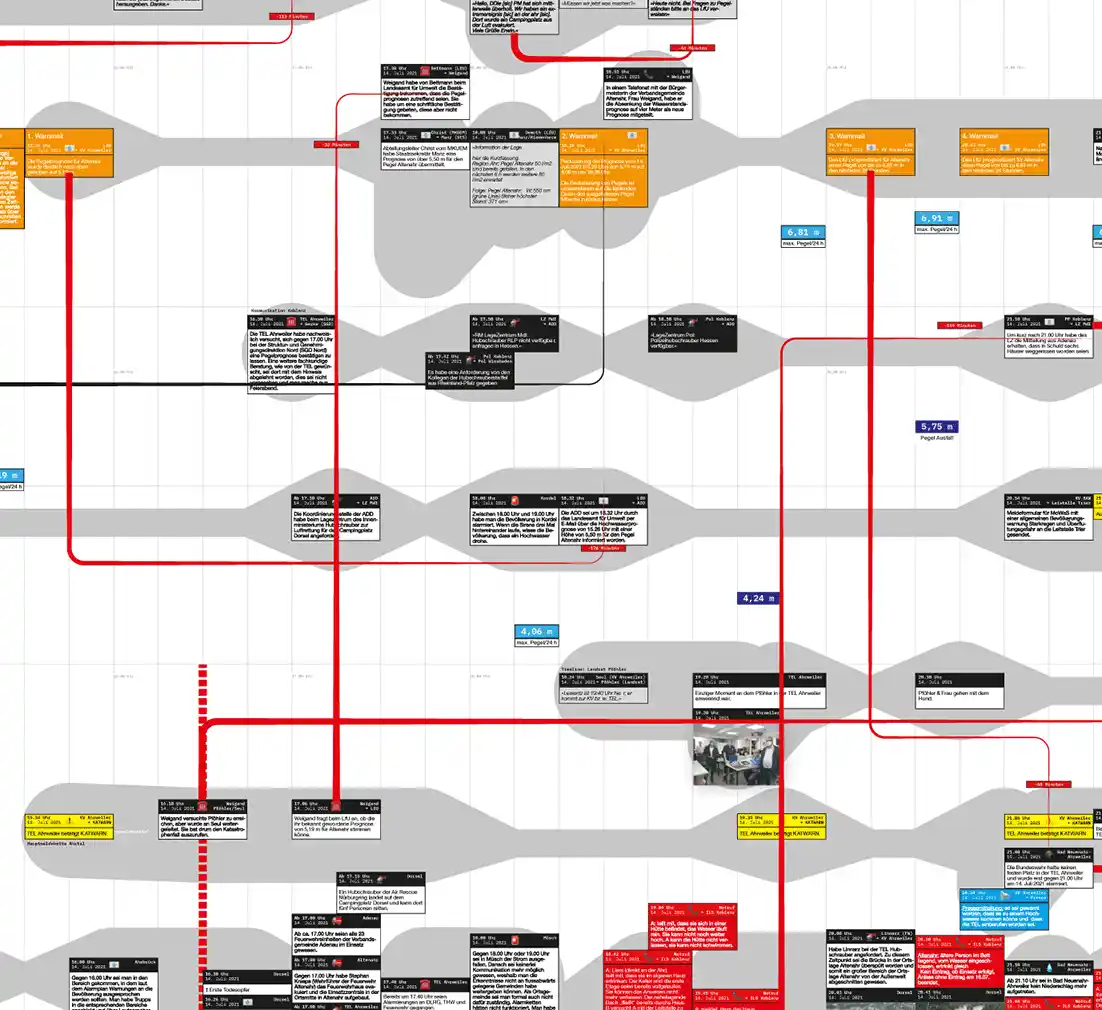
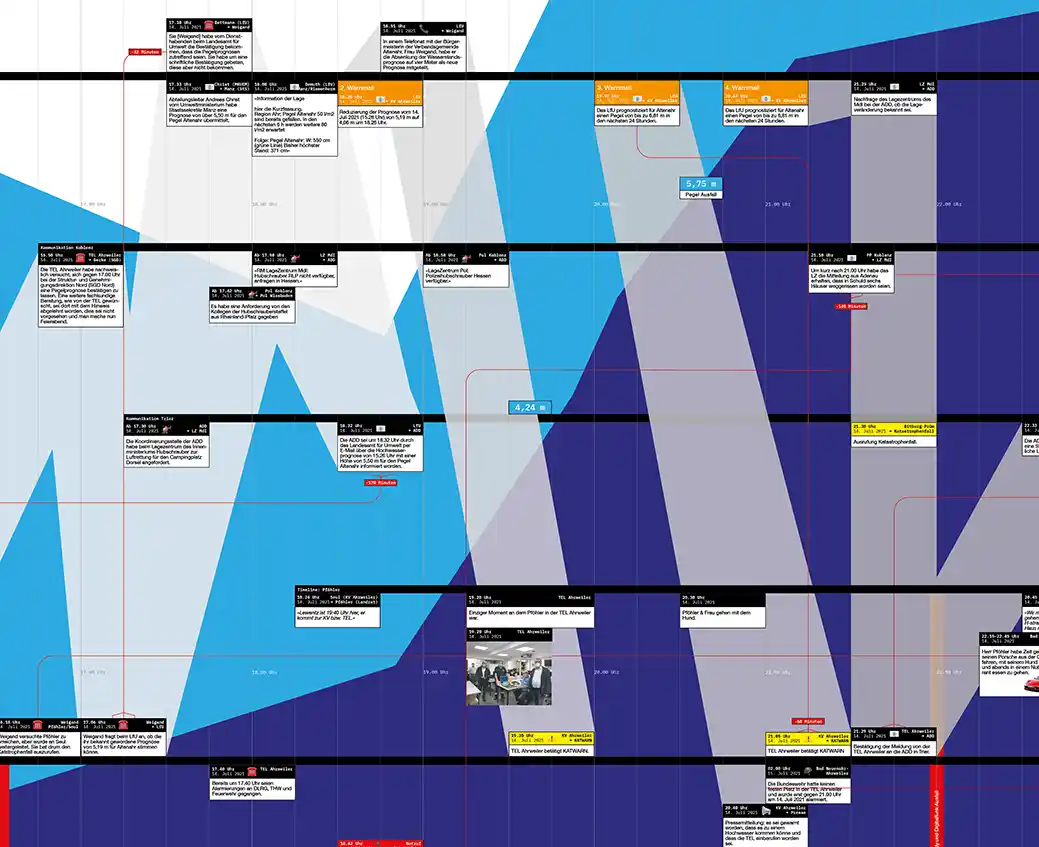
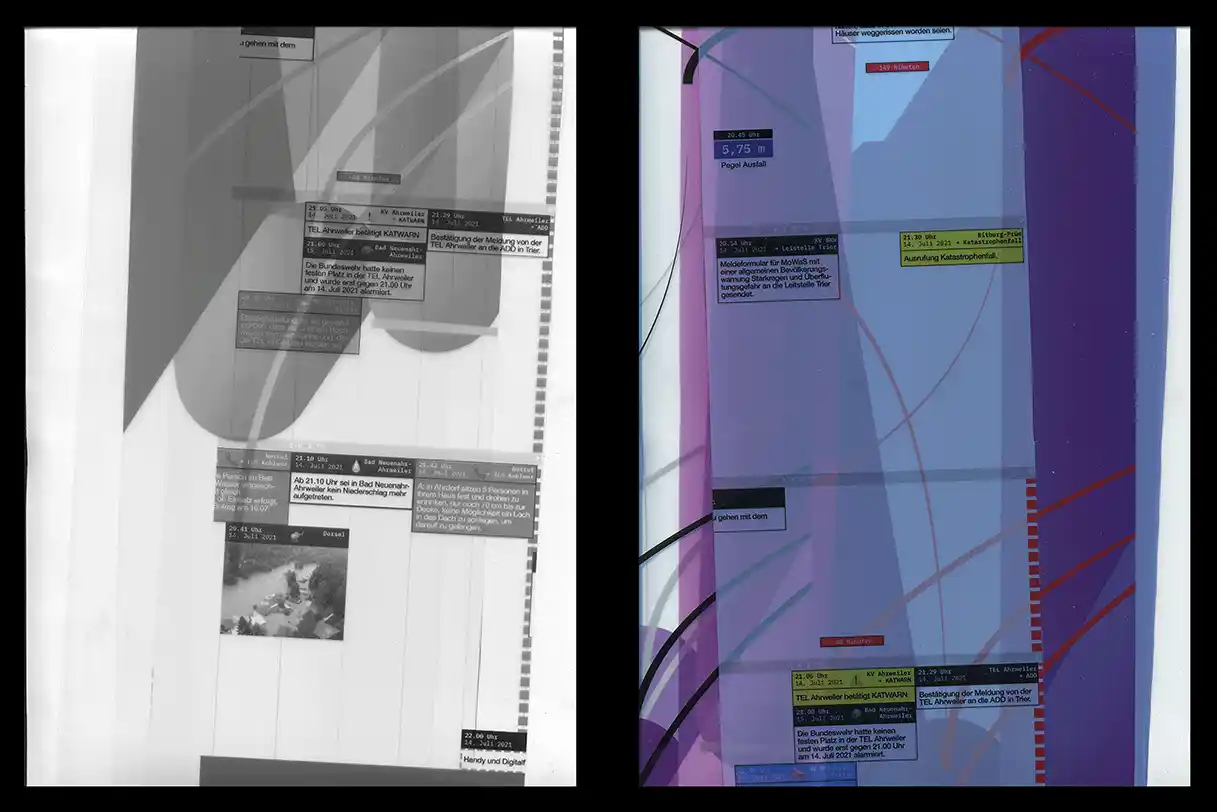
The challenge of the project was therefore not simply to visualize information, but to make complexity visible. The large quantity of qualitative and relational data resisted conventional forms of mapping. Instead of producing a complete reconstruction of every communication event, the project focused on identifying patterns, delays, and structural dependencies. Mapping became a method for understanding how information moved through different institutional layers and where communication processes became disconnected from the rapidly escalating situation.
The final work takes the form of a large-scale visual mapping that combines locations, actors, communication flows, and water level developments. Rather than presenting a definitive explanation of the disaster, it serves as an entry point into a highly complex system. The visualization highlights the gap between theoretical procedures and their practical execution, revealing how communication networks that appear orderly on paper can become fragmented and overwhelmed under real-world conditions. Ultimately, the project is not only about the Ahr Valley flood itself. It is an investigation into the limits of communication, the fragility of institutional structures during crises, and the challenge of making invisible processes visible through mapping.